Get Microsoft Graph Activity Logs Using Azure Portal
Microsoft Graph is an interface that enables developers and admins to access and manage a wealth of data across Microsoft 365 services. Among its key features, activity logs play a crucial role in monitoring and maintaining Microsoft 365 security. Microsoft Graph activity logs (preview) enhance the security analysis by storing the logs in the Azure Log Analytics interface or enabling exporting them to Azure Storage for long-term storage. Additionally, the logs can be streamed via Azure Event Hubs to external SIEM tools for alerting, analysis, or archival.
In this blog, we’ll explore how you can access Microsoft Graph activity logs through the Azure portal for valuable insights into user activities, security events, and more.
The following list gives the minimum license requirements and the privileges required to retrieve the Microsoft Graph activity logs:
- Security administrator or global administrator privileges
- Microsoft Entra ID P1 or P2 license
- Azure subscription
Microsoft Graph activity logs are a stream of HTTP requests received and executed for an M365 tenant. They consist of a list of API requests originating from SDKs, API clients, Microsoft applications, and business applications.
The insights from Microsoft Graph audit logs streamed in Azure Monitor are detailed at the bottom of the blog. The insights covered in MS Graph activity logs are commonly helps to:
- Easily spot problematic or unforeseen behaviors in client applications or SDKs like Microsoft Graph PowerShell, such as unusually high call volumes.
- Gain insights into the activities carried out by a compromised user account within your tenant.
- Conduct behavioral analysis to pinpoint potentially suspicious or unusual usage of Microsoft Graph APIs.
- Establish connections between Microsoft Graph requests made by a user or app and corresponding sign-in information.
The Microsoft Graph activity logs can be accessed by configuring the diagnostic setting to integrate the logs with Azure Monitor or through the Azure Resource Manager APIs. Let’s dive into the process of integrating activity logs with Azure Monitor logs and the process of accessing them.
- Integrate Microsoft Graph activity logs with Azure Monitor
- Access Microsoft Graph activity logs in the Azure portal
- Run query in Log Analytics workspace for filtered results
To access the Microsoft Graph activity logs, there is a requirement to integrate Microsoft Graph activity logs with Azure Monitor. The below list gives the step-by-step procedure to enable Microsoft Graph activity logs.
- Configure Log Analytics workspace in Azure Monitor
- Configure diagnostic settings for Microsoft Graph activity logs
A Log Analytics workspace serves as a centralized repository where you can collect and analyze data logs from diverse sources. As an integral part of Azure Monitor, it provides a scalable platform for managing and querying large volumes of data. In other words, it is a workspace in that you can configure data sources and store their data.
If you do not currently possess a Log Analytics workspace or wish to create a new workspace specifically for Microsoft Graph activity logs, you can establish a new one. Follow the steps outlined below to create a Log Analytics workspace in Azure and harness its capabilities.
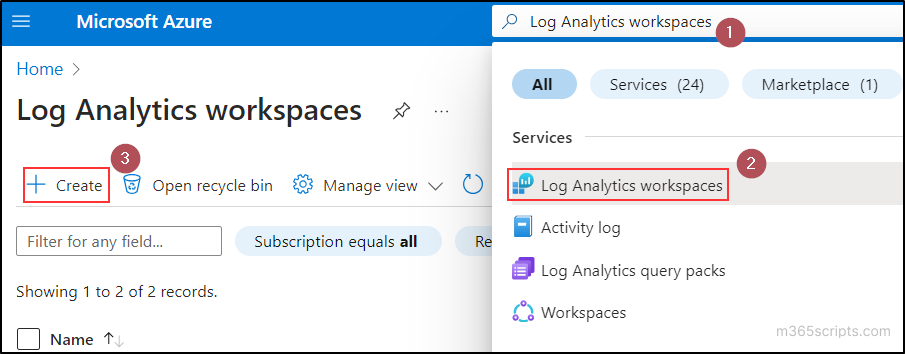
- Log in to the Azure portal, search for Log Analytics workspaces in the search bar, and select it.
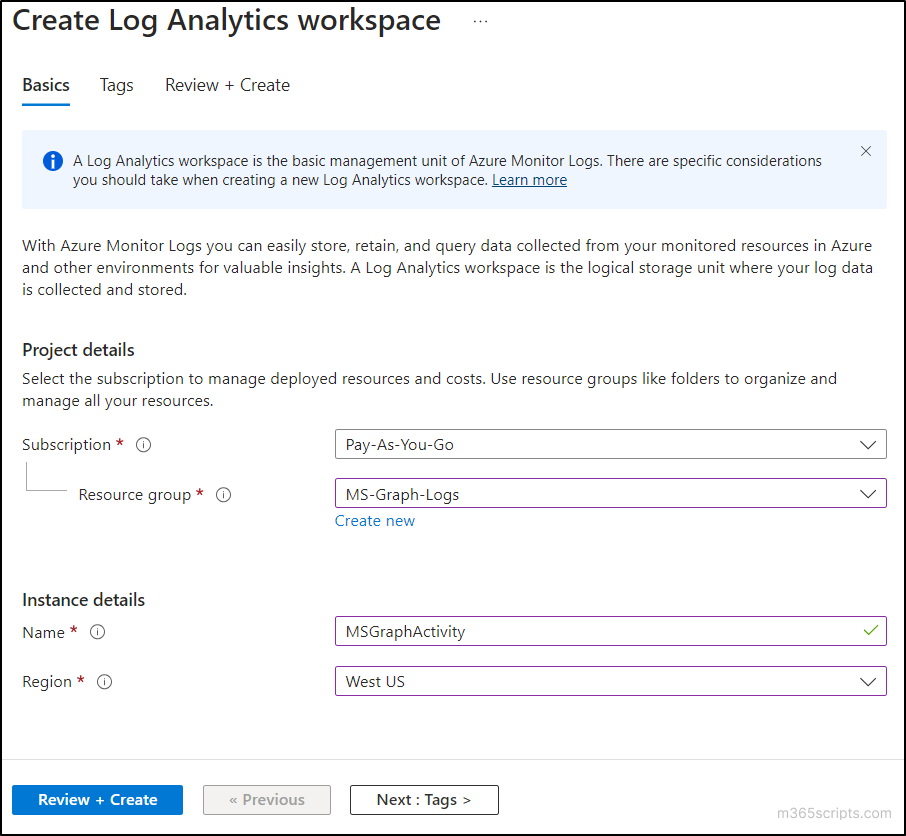
- Next, click on the Create button and choose the Azure subscription from the dropdown.
- Then, select the Resource group from the respective dropdown. If you don’t have any existing resource group or want to create a new resource group separately for Microsoft Graph audit logs, you can create using the Create new button.
Note: A resource group in Azure is a logical container that holds related Azure resources (Log Analytics workspace) for effective management. - In the Instance details section, type the name of your Log Analytics workspace in the Name text box.
- Select the Region from the dropdown where you want your workspace to be located based on the regulatory or compliance terms.
- After that, click on the Review + Create button.
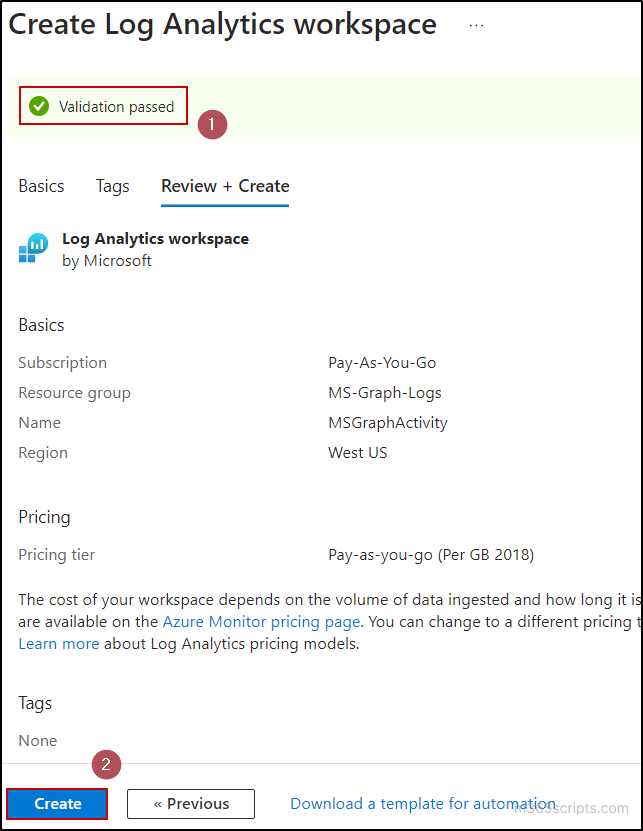
- Finally, ensure that the Validation passed message appears at the top, then review the details of your workspace and select the Create button.
The second step in the process is to configure a diagnostic setting in Azure Monitor. Here, we need to configure the setting for sending log information into the previously created workspace.
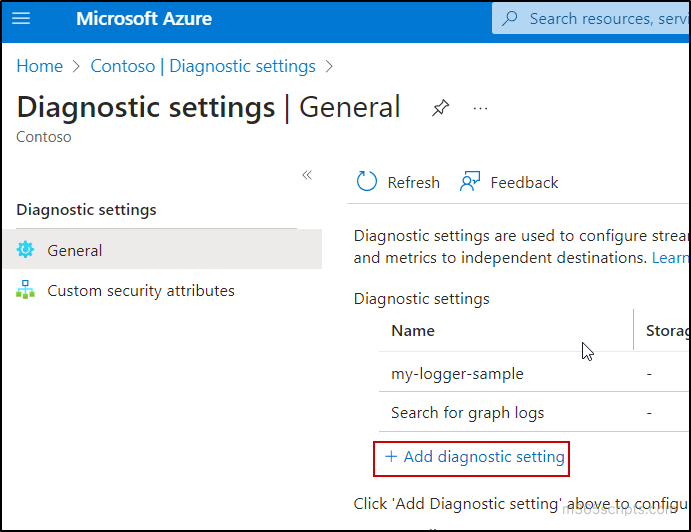
- In Azure portal, select the Diagnostic settings tab from the Monitoring category.
- Click on the Add diagnostic setting option.
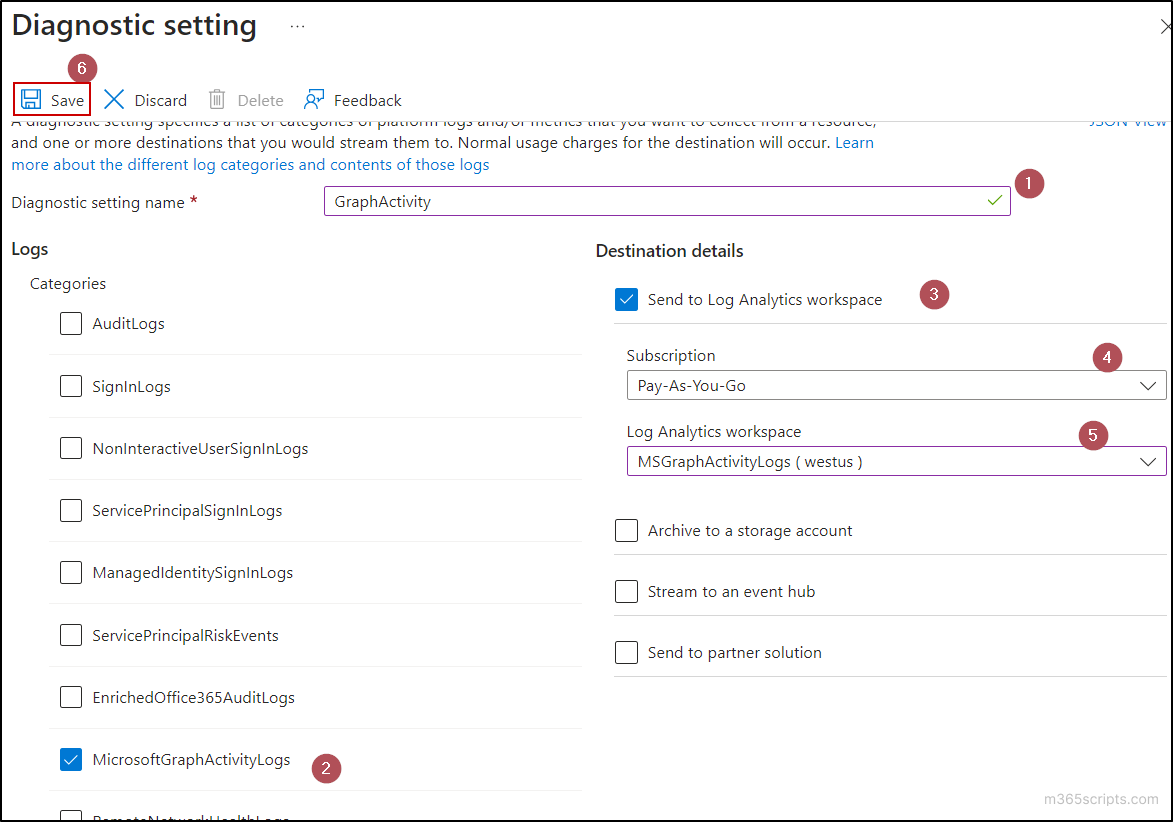
- Input a name for the diagnostic setting in the Diagnostic setting name text box.
- Select MicrosoftGraphActivityLogs from the list of Log categories.
- In the Destination details, select the check box Send to Log Analytics workspace.
- Select the Subscription and choose the Log Analytics workspace from respective dropdowns.
- Finally, click on the Save button.
After finishing all the above two processes, it may take about 30 minutes for the availability of respective logs in the Log Analytics workspace.
After creating the Log Analytics workspace, to fetch Microsoft Graph audit logs from the Azure portal follow the below steps:
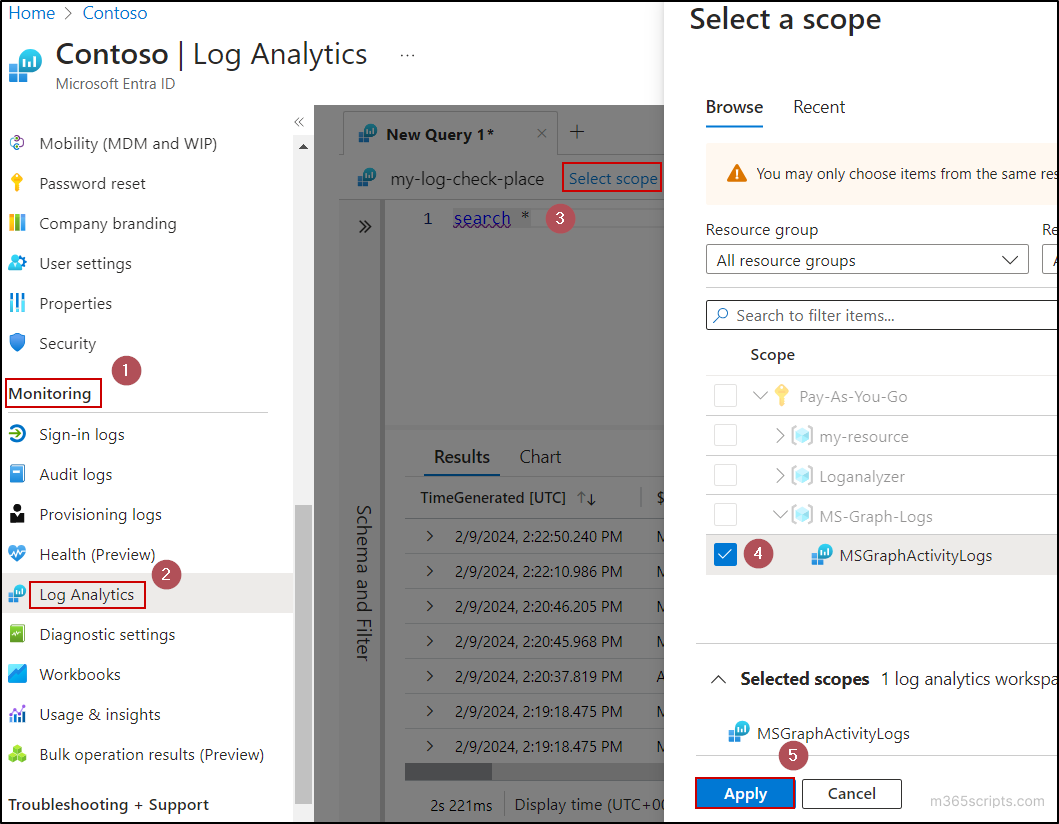
- Go to the Azure portal and go to the Log Analytics tab under the Monitoring category.
- Click on the Select scope button. After that, browse and select the Log Analytics workspace you have created for Microsoft Graph activity logs from the appropriate resource group.
- After selection, click on the Apply button.
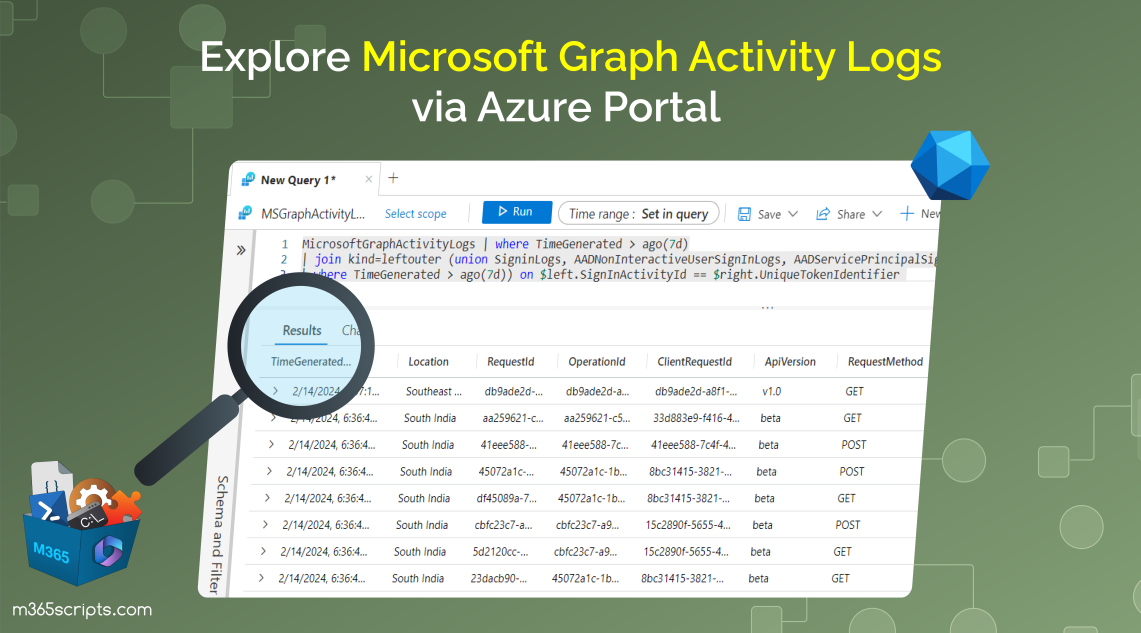
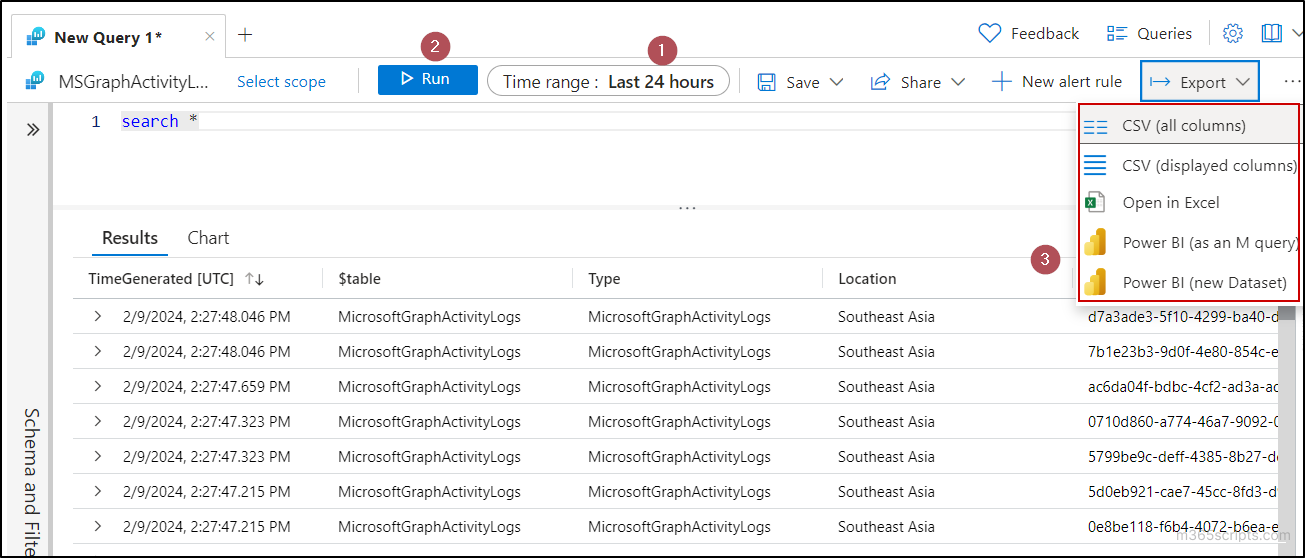
- In the Query editor, you can choose the Time range and select the Run option to get all the audit logs regarding the MS Graph activity.
- You can export the results to CSV, Excel, or Power BI using the Export option.
While the above option lists all the Graph activities, you also have the option to retrieve only the result with filtration using the Kusto query language.
To illustrate working with these logs, we can look at some basic Log Analytics queries that people widely use to filter the Microsoft Graph activities:
1. Group Operations in the Past Day:
The Kusto query provided below extracts information from Microsoft Graph activity logs, focusing on operations related to groups in the past day.
MicrosoftGraphActivityLogs| where TimeGenerated > ago(1d)| where RequestUri contains '/group'| where RequestMethod != "GET"| summarize UriCount=dcount(RequestUri) by AppId, UserId, ServicePrincipalId, ResponseStatusCode
2. Recent Authorization Failures:
The following Kusto query retrieves and displays details about recent requests that failed due to authorization issues. The query also limits the results to 1000 records to ensure that the output is manageable.
MicrosoftGraphActivityLogs| where TimeGenerated > ago(1h)| where ResponseStatusCode == 401 or ResponseStatusCode == 403| project AppId, UserId, ServicePrincipalId, ResponseStatusCode, RequestUri, RequestMethod| limit 1000
3. Top 20 Application Instances by Request Counts:
The Kusto query provided below filters and sorts the results, specifically focusing on the top 20 application instances based on their request counts.
MicrosoftGraphActivityLogs| where TimeGenerated > ago(1d)| summarize RequestCount=count() by AppId, IpAddress, UserAgent| sort by RequestCount| limit 20
4. Resources Accessed by Potentially Risky Users in the Last 30 Days:
The forthcoming Kusto query filters the Microsoft Graph activity logs to identify resources queried or modified by potentially risky users in the past 30 days.
MicrosoftGraphActivityLogs| where TimeGenerated > ago(30d)| join AADRiskyUsers on $left.UserId == $right.Id| extend resourcePath = replace_string(replace_string(replace_regex(tostring(parse_url(RequestUri).Path), @'(\/)+','/'),'v1.0/',''),'beta/','')| summarize RequestCount=dcount(RequestId) by UserId, RiskState, resourcePath, RequestMethod, ResponseStatusCode
5. Correlation with Sign-in Logs in the Last 7 Days:
The following query outputs correlated information between Microsoft Graph activity logs and various sign-in logs. It specifically focuses on the case that not all MS Graph logs have corresponding sign-in log entries.
The query retrieves Microsoft Graph activity logs generated in the past 7 days and performs a left outer join with a union of different sign-in logs, including SigninLogs, AADNonInteractiveUserSignInLogs, AADServicePrincipalSignInLogs, ADFSSignInLogs, and AADManagedIdentitySignInLogs.
MicrosoftGraphActivityLogs | where TimeGenerated > ago(7d) | join kind=leftouter (union SigninLogs, AADNonInteractiveUserSignInLogs, AADServicePrincipalSignInLogs, AADManagedIdentitySignInLogs, ADFSSignInLogs | where TimeGenerated > ago(7d)) on $left.SignInActivityId == $right.UniqueTokenIdentifier
Here is a list of known limitations that are related to the Azure Monitor’s MS Graph activity logs:
- The service is available globally; however, it is not accessible in specific national cloud deployments, including US Government L4, US Government L5 (DOD), and China operated by 21Vianet.
- Activities of multitenant apps can’t be viewed in another tenant.
- Diagnostic settings in the Azure portal can’t be employed to filter the logs.
- Some events can take up to 2 hours to be delivered in some rare cases.
In Azure’s Logs Analytics interface, the following data related to MS graph API requests are available:
| Column | Type | Description |
| AadTenantId | string | Represents the Azure AD tenant ID. |
| ApiVersion | string | Denotes the API version associated with the event. |
| AppId | string | Signifies the identifier assigned to the application. |
| ATContent | string | Reserved for potential future use. |
| _BilledSize | real | Indicates the size of the record in bytes. |
| ClientAuthMethod | int | Conveys how the client underwent authentication. 0 for public clients, 1 for client ID and secret, and 2 for client certificate. |
| ClientRequestId | string | Optionally provides the client request identifier. If absent, it equals the operation identifier. |
| DurationMs | int | Represents the duration of the request in milliseconds. |
| IdentityProvider | string | Specifies the identity provider that authenticated the subject of the token. |
| IpAddress | string | Denotes the IP address of the client from which the request originated. |
| _IsBillable | string | Indicates whether ingesting the data is billable. When false, ingestion is not billed to your Azure account. |
| Location | string | Designates the name of the region that served the request. |
| OperationId | string | Serves as the identifier for the batch. It is unique per request for non-batched requests and consistent for all requests in a batch. |
| RequestId | string | Represents the identifier associated with the request. |
| RequestMethod | string | Reflects the HTTP method used in the event. |
| RequestUri | string | Provides the URI associated with the request. |
| ResponseSizeBytes | int | Specifies the size of the response in bytes. |
| ResponseStatusCode | int | Represents the HTTP response status code for the event. |
| Roles | string | Indicates the roles mentioned in the token claims. |
| Scopes | string | Represents the scopes mentioned in the token claims. |
| ServicePrincipalId | string | Denotes the identifier of the service principal making the request. |
| SignInActivityId | string | Represents the identifier associated with the sign-in activity. |
| SourceSystem | string | Specifies the type of agent that collected the event, such as OpsManager for Windows agents, Linux for Linux agents, or Azure for Azure diagnostics. |
| TenantId | string | Represents the Log Analytics workspace ID. |
| TimeGenerated | datetime | Represents the date and time the request was received. |
| TokenIssuedAt | datetime | Denotes the timestamp when the token was issued. |
| Type | string | Signifies the name of the table. |
| UserAgent | string | Provides information about the user agent related to the request. |
| UserId | string | Represents the identifier of the user making the request. |
| Wids | string | Denotes the tenant-wide roles assigned to this user. |
Note: The field name IpAddress will be changed to IPAddress in the beta version. You will need to update any Kusto queries referencing this field when there is a change in the field name. The modification has already been implemented in certain regions.
While many of us view logs in Microsoft Graph, the capability to obtain the activities carried out within it is great! I hope that by following the instructions in this blog, you will be able to send Azure activity logs to Azure Monitor Log Analytics, especially for Microsoft Graph activities. Feel free to reach out through the comments section for any assistance regarding this blog.